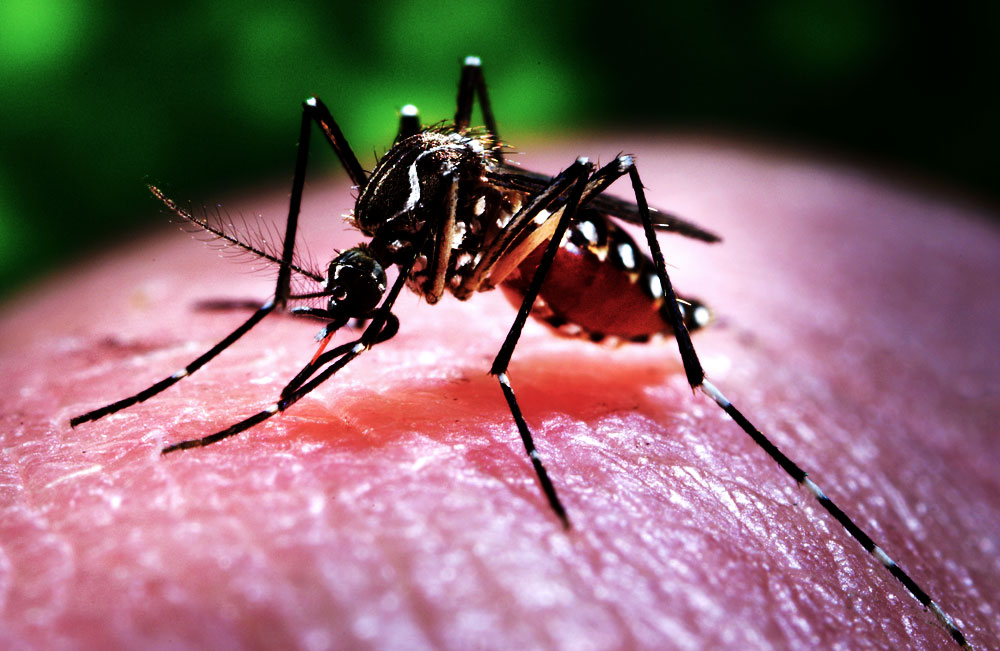
Dengue Hemorrhagic Fever (DHF) is a tropical disease and its spread is very wide. Control of disease is relatively easy, with community participation playing a vital role. However, the number of cases is still high. A study reported that unhealthy behavior of community contributed to the high incidence disease. Research evidence reports that geographic area often has an influence on disease, environmental also support the breeding of mosquitoes.
J.H. Abramson, 1988 stated that epidemiological data can be used for different purposes depending on the interest of study. Exploration of epidemiological data is expected to be able to find knowledge, the etiology of the disease, determine the natural history of the disease, and the development of a disease. In addition, to find the special condition of a disease in a region is to consider the number of people living in the area.
Scientific approach in this study will use epidemiological data to explain public health problems related to dengue cases in Pasuruan during the 2013-2017. The goal is to find the distribution pattern of DHF in an area.
The difference in the number cases each year varies, there is an increase and decrease cases. The absolute difference was obtained from highest and lowest cases, 325 – 122 = 203. The difference between the relative ratios in 2016 and 2017 is [122 – 325 / 325] 100% = 62.46%. In conclusion, DHF cases appear to have decreased sharply but in fact the cases are still high.
The number of cases each year is not uniform. Variation data shows changes in absolute values. By calculating the ratio of each observation or the percentage change between pairs of consecutive observations, it is possible to find a relative change to explain fact that the number of cases is involving the number of population. The assumption that can explain this phenomenon is the possibility that the number of cases varies randomly during this period.
The population for 2013-2017 is needed to find the relative changes each year. Percentage changes respectively are 0.89%; 0.69%; 0.71%; 0.76%; 0.70%. This information shows that when comparing the number of cases each year and the percentage change in population, it can be seen that the increase and decrease in the number of cases is influenced by the increase and decrease in population.
The following is an epidemiological concept of the distribution of disease according to population. Empirical evidence finds that villages that are geographically close to each other have the same vulnerability. Risk factors are also influenced by the number of residents in an area and environmental quality. Population distribution, area (km2), and density show differences in cases. Based on this scientific study, population size can be used to see the distribution pattern of disease in a different area, related to the dynamics of changes in population composition.
Author: Rachmah Indawati
Details of the research can be viewed here: https://medwinpublishers.com/PHOA/relation-between-population-fluctuations-and-dengue-cases-in-pasuruan-region-indonesia-2013-2017.pdf
Title: “Relation between Population Fluctuations and Dengue Cases in Pasuruan Region, Indonesia, 2013-2017.”


